

Copilot for Power BI offers several capabilities to enhance your data interaction and report creation experience, currently available in Power BI Service and Desktop.
As a report author, you can use Copilot to help you write DAX queries, streamline your semantic model documentation, provide a summary about your semantic model, and help you get started with report creation. Additionally, Copilot can also create a narrative visual that summarizes a page or a whole report and can generate synonyms for Q&A, to help report readers find what they're looking for in your reports.
Copilot can help authors with the following tasks:
- Summarize the underlying semantic model.
- Suggest content for a report.
- Create a report page.
- Create a summary visual on the report itself.
- Ask Copilot questions about data in the model.
- Add synonyms to enhance Q&A.
- Add descriptions for your semantic model measures.
- Write DAX queries.
Generate a summary of your report in the Copilot pane
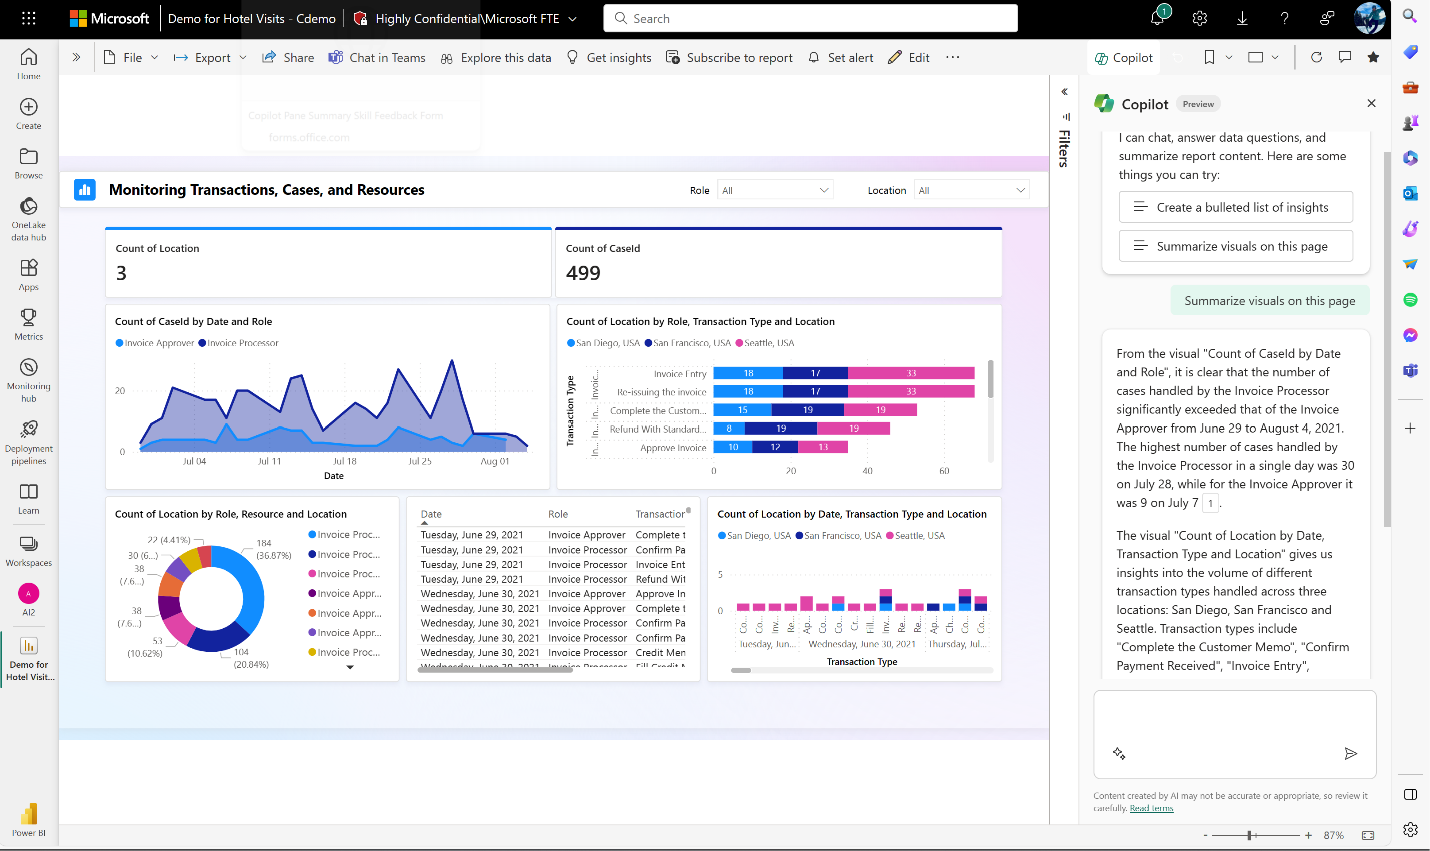
Even if you don't have edit permission for a report, with Copilot you can generate a summary of a report page in the Copilot pane. You have the flexibility to refine or guide the summary by customizing prompts, such as "summarize this page using bullet points" or "provide a summary of sales on this page."
You can also ask specific questions about the visualized data on a report page and receive a tailored response. This response includes references to specific visuals, aiding you in understanding the specific data sources contributing to each part of the answer or summary within the report.
Summarize the underlying semantic model
Summarize a Power BI semantic model by asking Copilot to "summarize the model" in the Copilot pane. This summary can help you gain a better understanding of data in your semantic model, identify important insights, and improve your data exploration experience. Ultimately, better understanding the semantic model can help you build more meaningful reports.
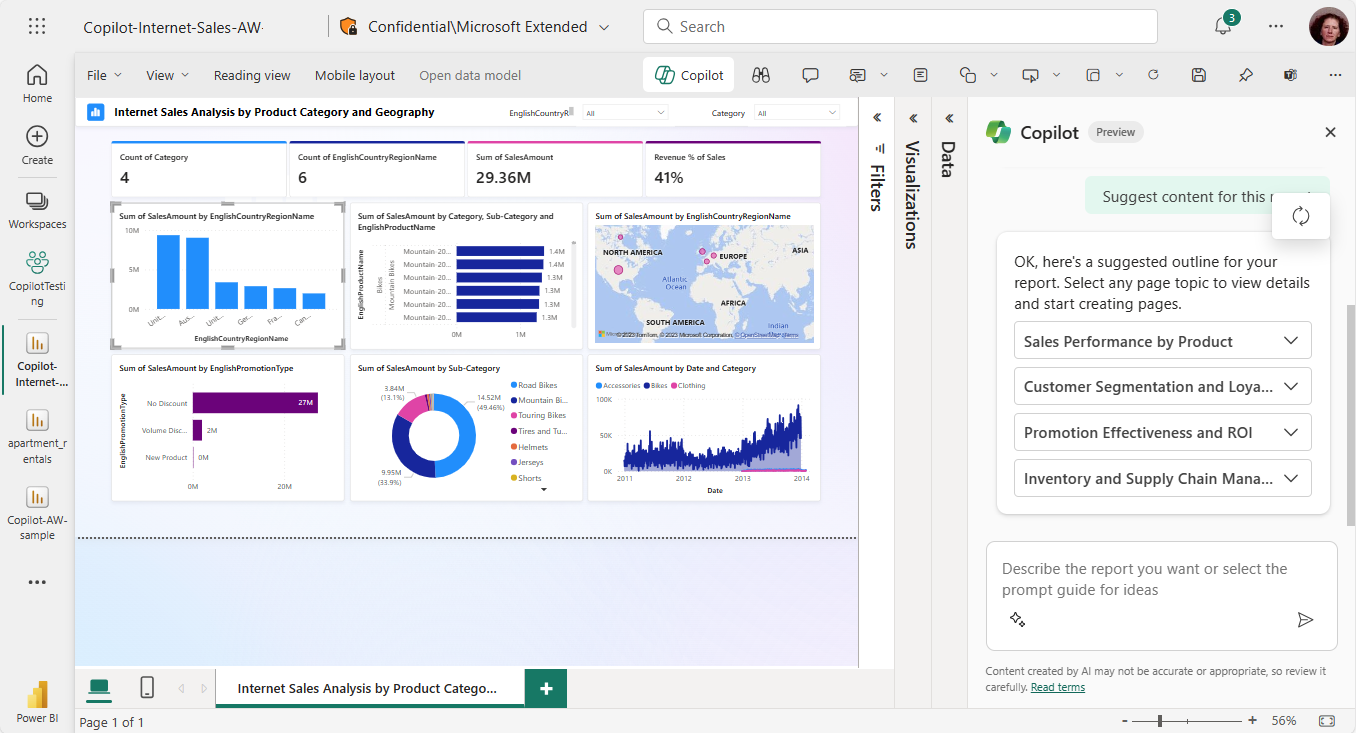
Suggest content for a report
Copilot can help you get started on a new report by suggesting topics based on your data. When you select this option directly in the chat, Copilot evaluates the data and provides a report outline with suggested pages that you can explore and choose to create for you.
• A report outline of suggested pages for your report: for example, what each page in the report is about, and how many pages it creates.
• The visuals for the individual pages.
Create a report page
Copilot for Power BI can help you create a report page by identifying the tables, fields, measures, and charts for your data. If you give Copilot a high-level prompt that's specific to your data, it can generate a report page that you can then customize and modify, using the existing editing tools. Copilot can help you get started on your report page quickly and save you a lot of time and effort in the process.
Here are some examples of high-level prompts to get you started:
- Create a page to evaluate the performance of different shifts based on good count, reject count, and alarm count over time.
- Create a page to analyze the efficiency of the production line and overall equipment effectiveness.
- Create a page to compare the cost and material of each product and their impact on production.
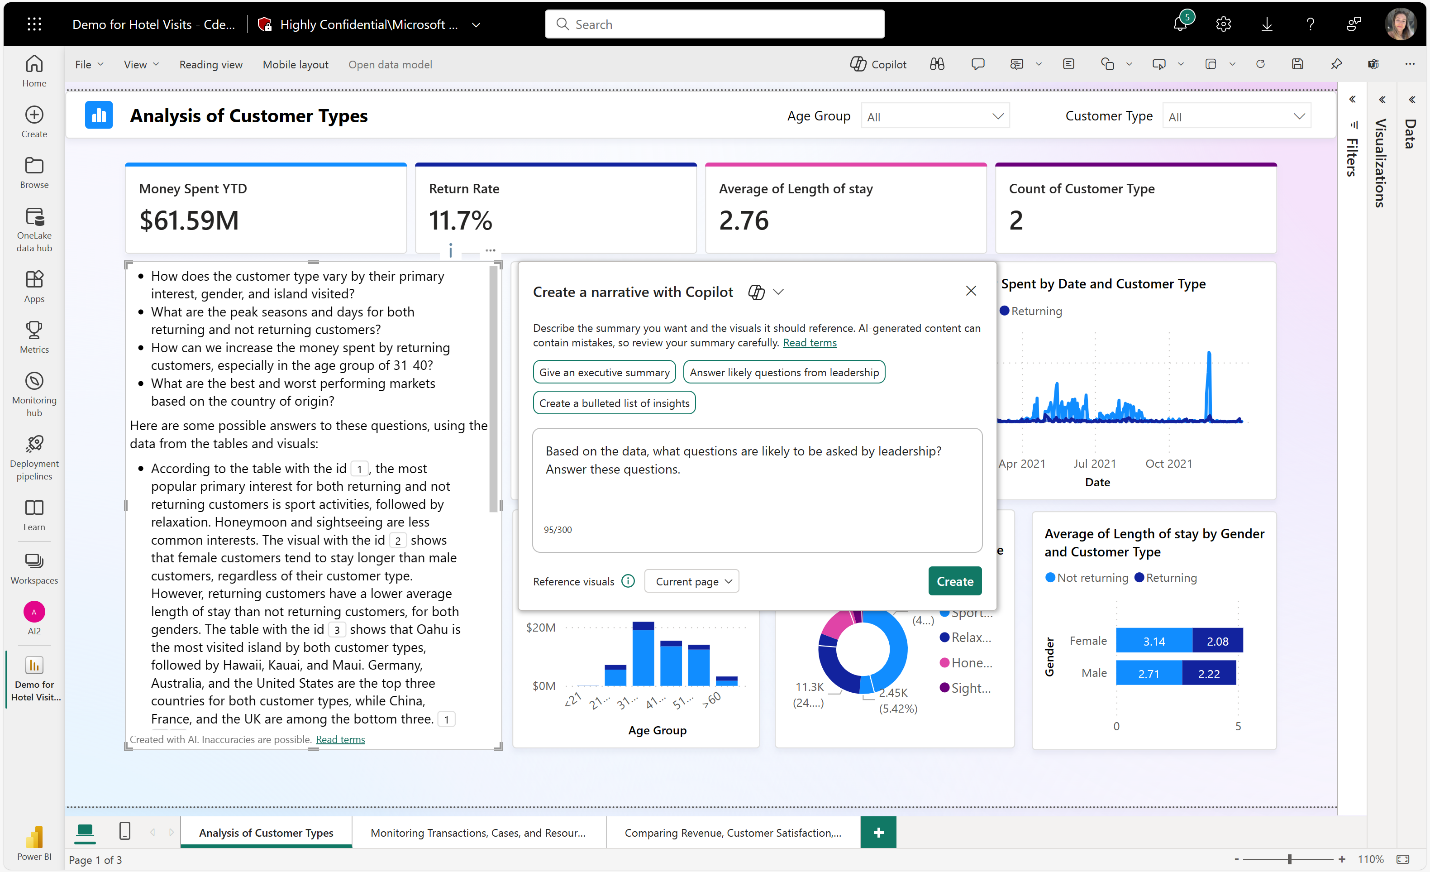
Create a summary visual on the report itself
In Power BI Desktop and Power BI service, you can use Copilot for Power BI to quickly create a narrative about a report page with just a few clicks. This narrative can summarize the entire report, specific pages, or even specific visuals that you select.
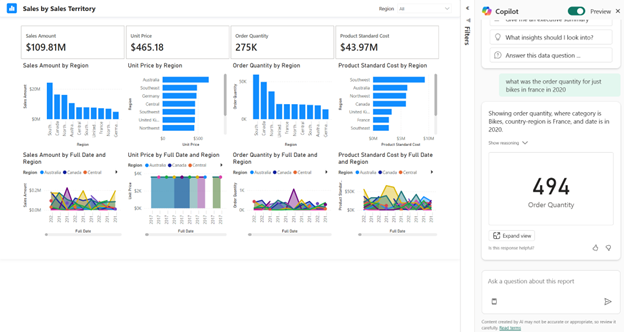
Ask Copilot questions about data in the model
Copilot can also use measures and columns in your semantic model to help you explore your data in new ways. As you ask questions about your reports and datasets, Copilot checks if the answer can be found in the report visuals. If existing visuals don't answer the question, Copilot then builds a visual for you.
Here are the sorts of requests that Copilot can help you with:
- Can I see this measure filtered to a different region or span of time?
- What are the top categories by a certain metric?
- Show me how this measure has changed over time.
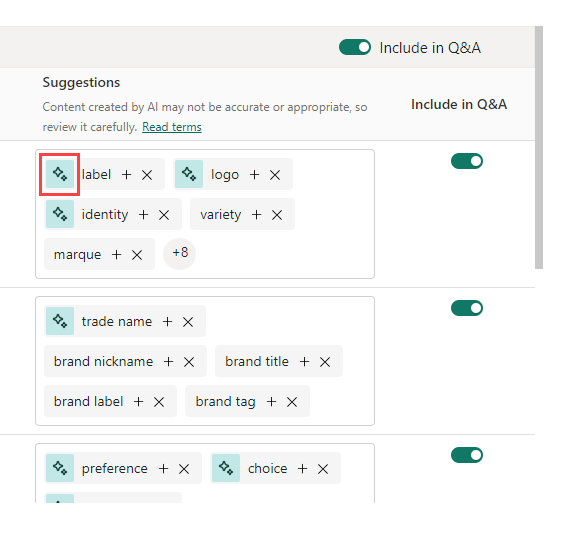
Synonyms to enhance Q&A
Copilot can write synonyms that you can add to Q&A to improve the Q&A visual's ability to understand user questions.
Add descriptions for semantic model measures
Copilot can add descriptions to your semantic model measures. People who build reports from your semantic model can see the name and description of your measures, which makes the description property essential documentation.
Write DAX queries
Copilot can write a DAX query. For example, you can type in a prompt to describe what DAX query you would like it to generate, and select Send or press Enter. To run what is returned, select Keep it to add it to the query tab. Then select Run or press F5 to see the results of the DAX query. Read more in the article


Blog liked successfully
Post Your Comment
Rahul Shukla
Intéressant comme vous présentez le piège des mises progressives qui paraissent rusées mais qui perdent inévitablement.