

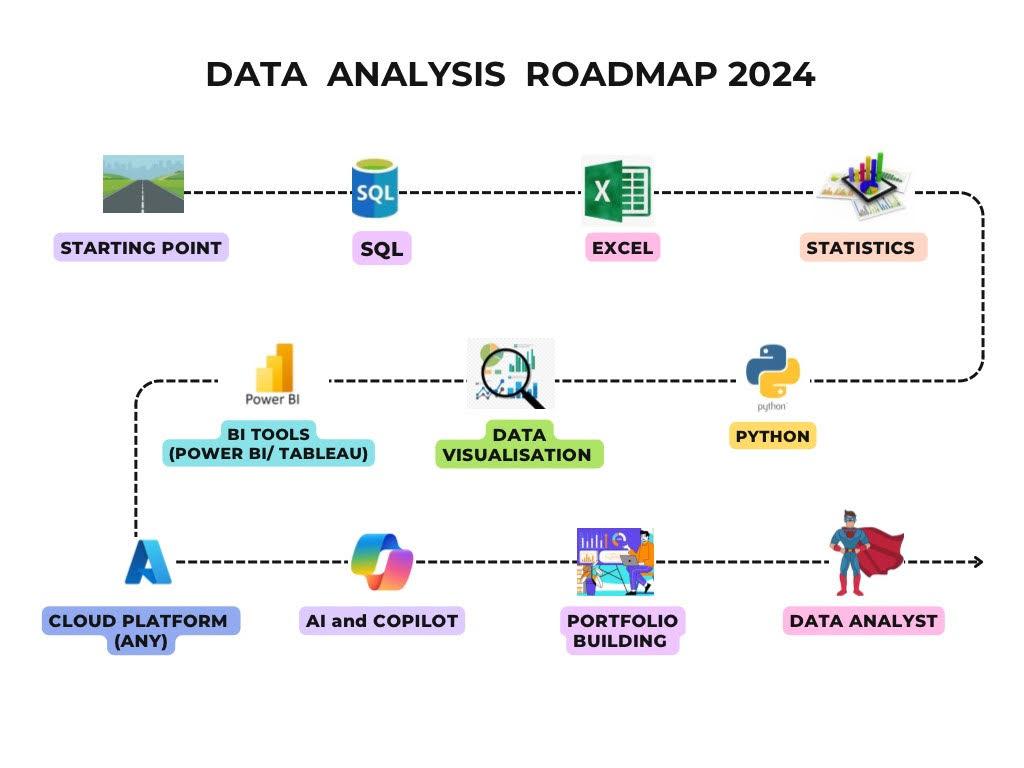
In today's data-driven world, mastering data analysis is crucial for making informed decisions. Whether you're a beginner or looking to enhance your skills, following a structured roadmap can help you navigate through the essential tools and techniques.
Here's a comprehensive guide to each step on your data analysis journey:
1. SQL (Structured Query Language)
SQL is the foundation of data analysis, essential for managing and querying relational databases.
As a data analyst, you'll often need to extract and manipulate data stored in databases. SQL enables you to retrieve specific data efficiently, join tables, and perform aggregations, making it indispensable for handling large datasets.
What to Learn:
💠 Data Definition Language (DDL)
- CREATE, ALTER, DROP
- Constraints (PRIMARY KEY, FOREIGN KEY, UNIQUE, CHECK)
💠 Data Types and Conversion
💠 Basic SQL Queries
- SELECT statements
- WHERE clause
- ORDER BY clause
- DISTINCT keyword
💠 Data Manipulation
- INSERT, UPDATE, DELETE
- MERGE statement
💠 Set Operations
💠 Advanced Filtering
- Using AND, OR, NOT operators
- BETWEEN, IN, LIKE, and IS NULL
💠 Aggregate Functions
- COUNT, SUM, AVG, MIN, MAX
- GROUP BY and HAVING clauses
💠 Joins
💠 Subqueries
💠 Common Table Expressions (CTEs)
💠 Window Functions
💠 Stored Procedures and Functions
💠 Transactions and Concurrency
💠 Performance Optimization: Improve query efficiency using indexing, query plans, and execution times.
2. Excel
Excel is a versatile tool for data organization, analysis, and visualization.
Despite the availability of advanced tools, Excel remains a staple in data analysis due to its user-friendly interface and powerful functions. It allows you to perform quick calculations, create pivot tables, and visualize data through charts and graphs, making it ideal for initial data exploration and reporting.
What to Learn:
📚 Basic Functions and Formulas: Start with essential functions like SUM, AVERAGE, COUNT, IF, and VLOOKUP. These are the building blocks for more complex calculations.
📚 Data Cleaning Techniques: Master techniques like removing duplicates, handling missing values, and using Text to Columns for data preprocessing.
📚 Pivot Tables: Learn to create and manipulate pivot tables to summarize large datasets and extract meaningful insights.
📚 Data Visualization: Get proficient in creating various chart types (bar, line, pie, scatter, etc.) and using conditional formatting to highlight key data points.
📚 Advanced Formulas: Dive into more advanced formulas like INDEX-MATCH, ARRAYFORMULA, and nested IF statements to handle complex data analysis tasks.
📚 Macros and VBA: Understand the basics of macros and VBA to automate repetitive tasks and enhance efficiency.
📚 Excel Copilot
3. Statistics
Statistics provides the mathematical foundation for analyzing and interpreting data.
Understanding statistical concepts is crucial for making sense of data and drawing accurate conclusions. It helps you perform hypothesis testing, identify correlations, and understand distributions, which are vital for making data-driven decisions and predictions.
What to Learn:
Descriptive Statistics:
📚 Measures of Central Tendency
- Mean
- Median
- Mode
📚 Measures of Dispersion
- Range
- Variance
- Standard Deviation
- Interquartile Range (IQR)
📚 Measures of Relationship
- Correlation
- Covariance
📚 Data Distribution
- Frequency Distribution
- Histograms
- Box Plots
4. Python
Python is a versatile programming language widely used for data analysis, automation, and machine learning.
Python’s rich ecosystem of libraries like Pandas, NumPy enables you to handle, analyze, and model data efficiently. Its ability to automate repetitive tasks and perform complex analyses makes it a powerful tool for any data analyst, enhancing productivity and analytical capabilities.
What to Learn:
📚 Variables, Data Types and Operators in Python
📚 Data Structures in Python:
- List
- Tuples
- Dictionaries
- Sets
📚 Searching and Sorting
📚 Data Cleaning and Preprocessing
- Data Cleaning Techniques
- Handling Missing Values
- Data Transformation (Scaling, Normalization)
- Handling Outliers
- Data Preprocessing
- Encoding Categorical Variables
- Feature Engineering
- Feature Selection
📚 Data Analysis Libraries:
- NumPy
- Arrays and Matrices
- Array Operations
- Broadcasting
- Mathematical Functions
- Pandas
- DataFrames and Series
- Indexing and Slicing
- Data Manipulation (Filtering, Sorting, Grouping)
- Merging and Joining DataFrames
- Handling Missing Data
- Pivot Tables
- Matplotlib and Seaborn
- Basic Plotting with Matplotlib (Line, Bar, Scatter, Histogram)
- Customizing Plots (Titles, Labels, Legends)
- Advanced Visualizations with Seaborn (Heatmaps, Pair Plots, Violin Plots)
5. Data Visualization
Data visualization involves representing data through graphical formats like charts, graphs, and dashboards.
Visualizing data helps in understanding complex datasets and communicating insights effectively. Tools like Power BI, Tableau, Python libraries like Matplotlib, Seaborn and Excel charts allow you to create compelling visualizations that can reveal patterns, trends, and outliers, making it easier to share findings with stakeholders.
What to Learn:
📚 Bar Charts and Column Charts
📚 Line Charts
📚 Pie Charts and Donut Charts
📚 Histograms
📚 Scatter Plots
📚 Box Plots
📚 Heatmaps
📚 Tree Maps and Sunburst Charts
📚 Area Charts
📚 Waterfall Charts
📚 Funnel Charts
📚 Interactive Visualizations
- Filters and Slicers
- Drill-Down and Drill-Through
- Tooltips and Hover Effects
📚 Storytelling with Data
- Creating Data Stories
- Narrative Techniques in Data Visualization
6. BI Tools- Power BI/Tableau
Business Intelligence (BI) tools are software applications that analyze and visualize data to support decision-making.
Power BI enables you to create detailed reports and interactive dashboards, facilitating better data-driven decision-making. Its ability to integrate with various data sources and its user-friendly interface make it a valuable tool for creating comprehensive and accessible data presentations.
Tableau is renowned for its powerful visualization capabilities, intuitive interface, and flexibility in handling different data sources.
What to Learn:
📚 Data Import and Transformation
📚 Connecting to Data Sources
- Importing Data from Various Sources (Excel, CSV, SQL Server, Web)
- Direct Query vs. Import Mode
📚 Power Query Editor
- Data Cleaning and Transformation
- Merging and Appending Queries
- Handling Missing Data
- Unpivoting and Pivoting Data
📚 Data Modeling
- Creating Relationships
- Data Model Design
- Calculated Columns and Measures
📚 DAX (Data Analysis Expressions)
📚 Adding and Customizing Visuals
📚 Conditional Formatting
📚 Publishing and Sharing Reports
📚 Embedding Power BI Reports with Other Applications
📚 Connecting Power BI to Azure Data Services
📚 Power BI Copilot
📚 Security and Performance Optimization
7. Cloud Platforms
Cloud platforms like Azure, Google Cloud, and AWS offer scalable computing resources and services for data storage and analysis.
As data volumes grow, cloud platforms provide the infrastructure needed to store, process, and analyze large datasets efficiently. They offer scalability, flexibility, and cost-efficiency, allowing you to leverage powerful tools and services for advanced data analysis without the need for significant on-premises resources.
What to Learn:
📚 Data Ingestion on cloud
📚 Data Modeling and Storage on cloud
📚 Data Transformations on cloud
📚 ETL(Extract Transform and Load) on cloud
📚 Monitoring and Optimizations on cloud
📚 Azure Copilot for Data Analysis
8. AI & Copilot
AI involves using algorithms and models to perform tasks that typically require human intelligence. Copilot refers to AI-powered tools that assist in coding and data tasks.
AI and Copilot tools in data analysis, such as Excel and Power BI Copilot, automate complex tasks, offer data-driven insights, and enhance productivity by providing intelligent recommendations and visualizations. Understanding these tools is crucial for data analysts to efficiently handle large datasets, derive actionable insights, and stay competitive in the evolving data landscape.
9. Portfolio Building
A portfolio showcases your data analysis projects, skills, and achievements.
Building a strong portfolio is crucial for demonstrating your expertise and practical experience to potential employers or clients. It provides tangible evidence of your abilities, highlighting your proficiency with various tools and techniques, and helping you stand out in a competitive job market.
Conclusion
Embarking on the journey to become a data analyst involves mastering a range of tools and techniques. By following this roadmap, you will develop a comprehensive skill set that empowers you to analyze data effectively and derive valuable insights. Start with SQL, build your knowledge step-by-step, and culminate with a strong portfolio to showcase your analytical prowess.
Happy analyzing!

Blog liked successfully
Post Your Comment