

In the era of big data, organizations are constantly seeking ways to turn raw data into actionable insights. Power BI, a leading business analytics tool from Microsoft, has emerged as a game-changer in this space. But what makes Power BI so special, and why should data analysts and businesses alike pay attention? Let's dive into the essentials.
What is Power BI?
Power BI is a business intelligence tool designed to help users visualize and share their data insights. It allows you to transform raw data into visually appealing and interactive dashboards and reports, making it easier to understand complex information and drive data-driven decisions. With Power BI, you can connect to various data sources, model your data, and present it in a way that’s accessible to everyone, from data experts to decision-makers.
Why Power BI?
Power BI stands out for several reasons. First, it’s user-friendly, meaning that even those with limited technical expertise can start creating powerful data visualizations quickly. Its integration with other Microsoft products, such as Excel and Azure, further enhances its appeal, making it a natural choice for businesses already within the Microsoft ecosystem. Additionally, Power BI's affordability, with a free version available, makes it accessible to organizations of all sizes.
Features of Power BI
Power BI is packed with features that make it a versatile tool for data analysis:
- Interactive Visualizations: Power BI offers a wide range of visualization options, from bar charts to complex heat maps, all of which are interactive. Users can drill down into data points, filter information on the fly, and explore data from different angles.
- Customizable Dashboards: Power BI allows users to create personalized dashboards that can be tailored to meet specific needs. These dashboards can be shared across the organization, ensuring everyone has access to the latest insights.
- Data Connectivity: Power BI can connect to hundreds of data sources, both on-premises and in the cloud, including Excel, SQL Server, Azure, Google Analytics, and more. This connectivity allows for a comprehensive view of your data, regardless of where it’s stored.
- Real-Time Data Access: With real-time data streaming capabilities, Power BI enables users to monitor business metrics as they happen. This feature is particularly valuable for tracking live sales data, social media trends, or operational metrics.
- Advanced Analytics: Power BI integrates with R and Python, allowing data analysts to perform advanced analytics and predictive modeling. This adds depth to the analysis and enables the extraction of more sophisticated insights.
- AI-Powered Insights: Power BI includes AI-driven features such as natural language processing, where users can ask questions about their data in plain English and receive answers in the form of visualizations.
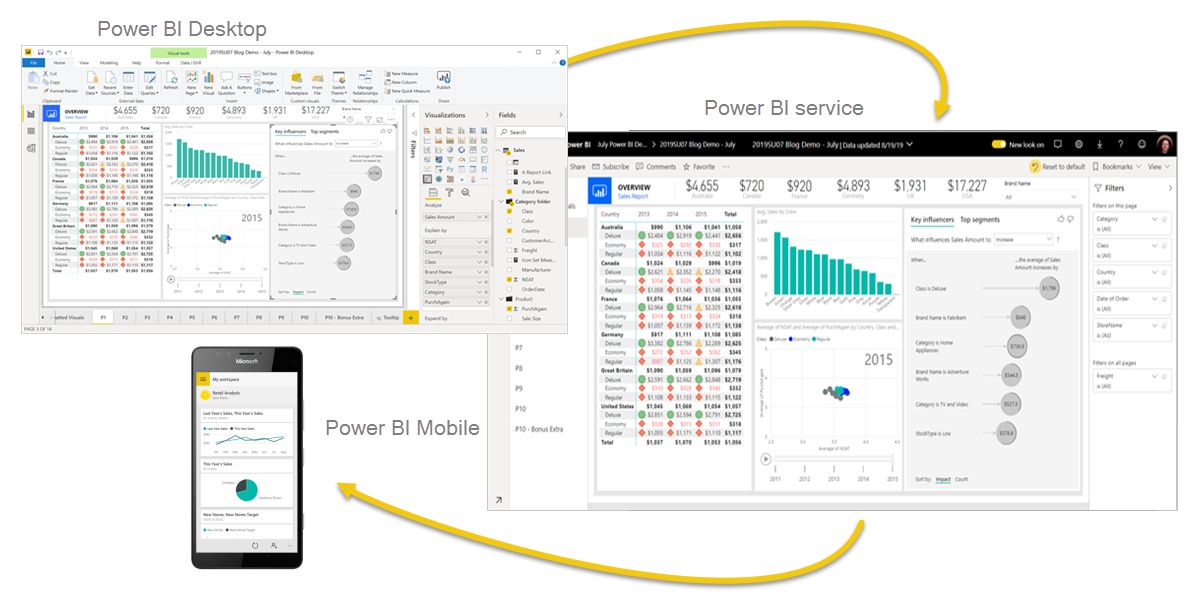
Power BI Architecture
Power BI consists of several elements that all work together. The architecture consists of:
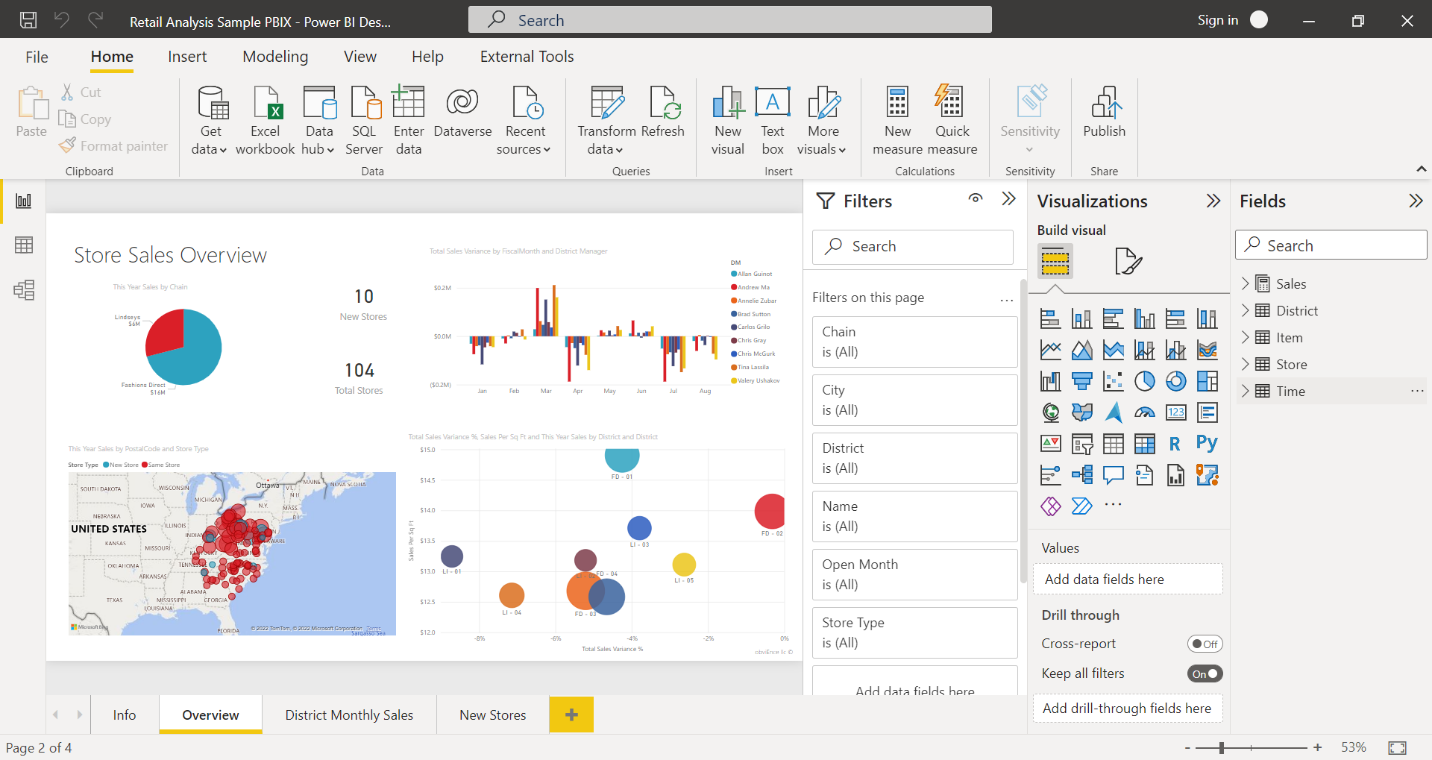
- Power BI Desktop: This is the primary development tool used by data analysts to create reports and dashboards. It allows users to import data, model it, and design visualizations.
- Power BI Service: A cloud-based platform where reports and dashboards can be published and shared. The service also offers collaboration features, enabling teams to work together on data projects.
- Power BI Mobile: The mobile app allows users to access reports and dashboards on the go, ensuring that data-driven insights are always within reach.
- Power BI Gateway: This component enables secure data transfer between on-premises data sources and the Power BI service, ensuring that the data is up-to-date.
Applications of Power BI
Power BI is used across various industries to solve business challenges and optimize operations. Some common applications include:
- Sales and Marketing: Power BI helps sales teams track performance metrics, identify sales trends, and monitor customer behavior, allowing for more targeted marketing strategies.
- Healthcare: Hospitals and clinics use Power BI to analyze patient data, track treatment outcomes, and optimize resource allocation, leading to improved patient care.
- Finance: Financial analysts leverage Power BI to monitor market trends, assess risks, and make informed investment decisions based on real-time data.
- Manufacturing: Power BI is used to monitor production processes, track equipment performance, and reduce operational downtime, ultimately improving efficiency and product quality.
Companies Using Power BI
Many leading organizations have adopted Power BI to enhance their data analysis capabilities. Some examples include:
- Nestlé: The global food and beverage giant uses Power BI to gain insights into its supply chain, helping to optimize logistics and reduce costs.
- Coca-Cola: Power BI is used by Coca-Cola to analyze sales data across different regions, enabling more effective sales strategies and better market penetration.
- BP: The multinational oil and gas company uses Power BI to monitor operational data in real-time, improving safety and efficiency across its global operations.
Power BI is more than just a data visualization tool; it’s a comprehensive platform that empowers organizations to unlock the full potential of their data. Whether you’re a data analyst looking to enhance your capabilities or a business leader seeking to drive better decisions, Power BI offers the tools you need to succeed in today’s data-driven world. With its robust features, scalable architecture, and widespread adoption, Power BI is poised to remain a key player in the business intelligence landscape for years to come.


Blog liked successfully
Post Your Comment